Next-Level Code. Nexuvibe Style ...
Hrs
Min
Sec

Traffic is not a single number. It is a collection of individual journeys, each with a starting point, a path through your site, and an outcome. When you look at your analytics and see “10,000 visitors this month,” that number obscures the information you actually need: where those visitors came from, what they did on your site, and whether the experience you provided matched what they were looking for.
Understanding traffic sources, referrers, and visitor journeys is not optional knowledge for anyone who wants to grow a WordPress site. It is the foundation. Every marketing decision, every content strategy, every UX improvement, and every budget allocation depends on understanding where your visitors come from and what they do after they arrive.
This guide covers the complete picture: the different types of traffic sources and what each one tells you about visitor intent, how referrer tracking works technically, and how session journey data reveals the actual experience visitors have on your site.
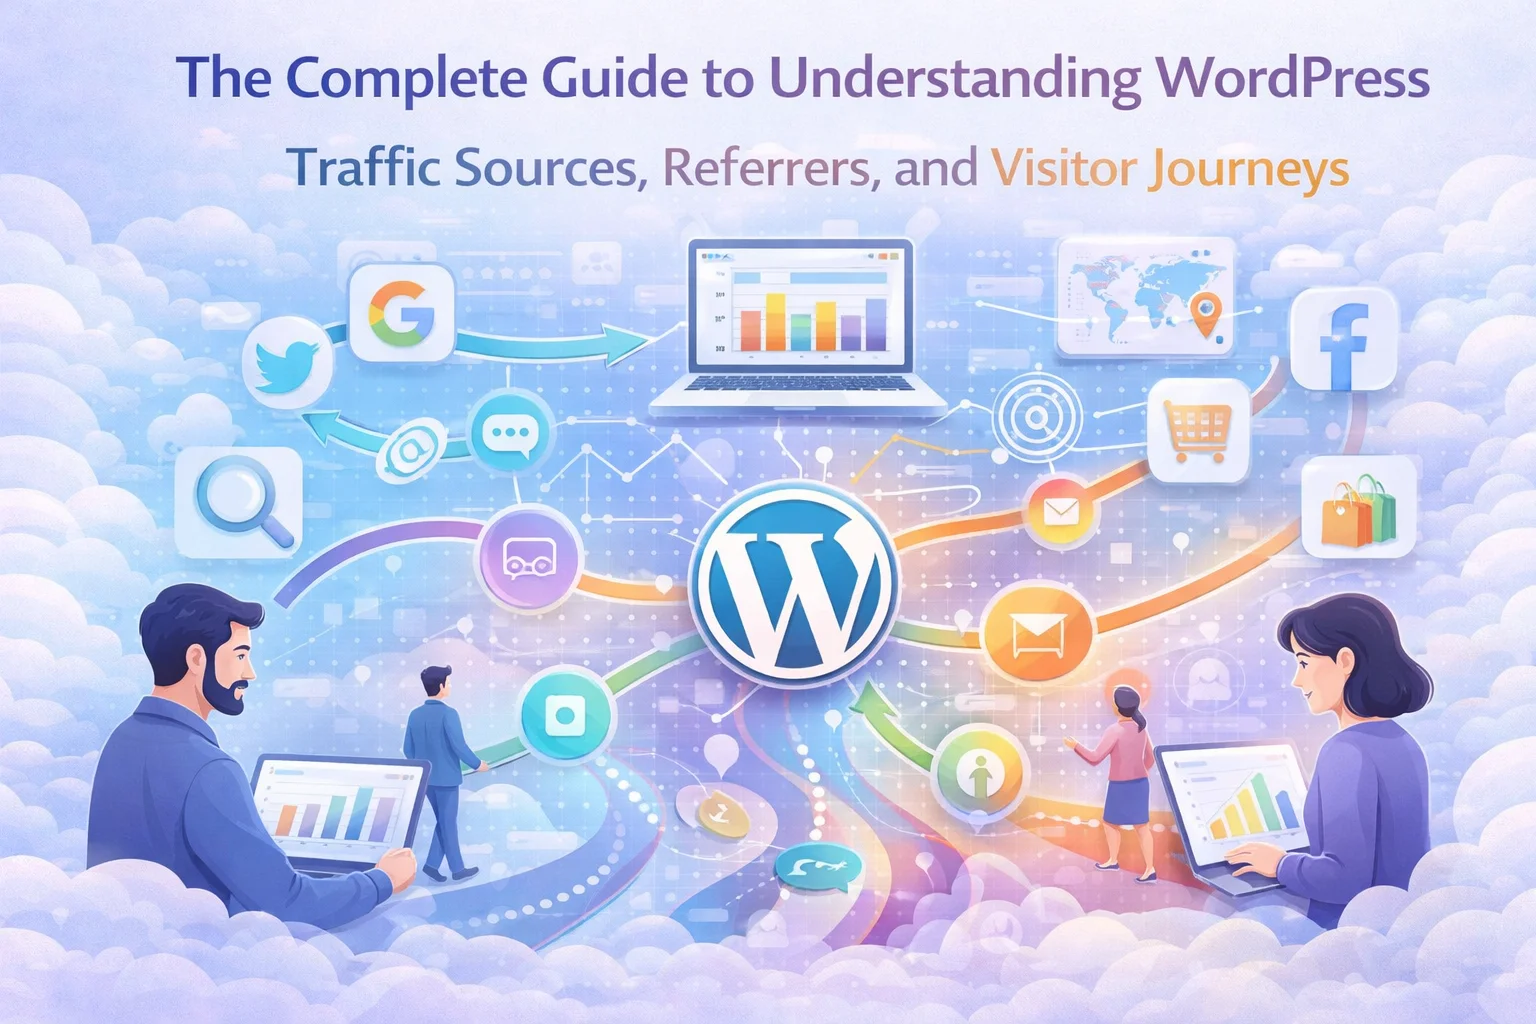
Every visitor arrives at your WordPress site through one of four primary channels: organic search, direct visits, referral traffic, or social media. Each channel carries different signals about what the visitor is looking for and how likely they are to engage deeply with your content.
Organic search traffic comes from people who typed a query into Google, Bing, or another search engine and clicked on your result. These visitors have the highest intent of any traffic source because they actively searched for something your content addresses. Understanding which search queries bring visitors to your site (available through Google Search Console, which works independently of your on-site analytics) tells you what problems your audience is trying to solve. Your on-site analytics then show you what those visitors do after they arrive: which pages they view, how long they stay, and whether they explore further or leave immediately.
Direct traffic consists of visitors who typed your URL directly into their browser, used a bookmark, or clicked a link in an email or messaging app that does not pass referrer information. High direct traffic often indicates strong brand recognition. If people know your site well enough to visit directly, you have built brand awareness effectively.
Referral traffic comes from links on other websites. When another blog, news site, or directory links to your content and someone clicks that link, your analytics records the referring domain. This data tells you who is linking to you, which of their audiences respond to your content, and which partnerships or guest posting efforts are generating actual traffic.
Social media traffic arrives from platforms like Twitter, Facebook, LinkedIn, Pinterest, and others. Social traffic tends to have different engagement patterns than search traffic: often higher volume during spikes but shorter session durations and higher bounce rates. Understanding these patterns helps you set realistic expectations for social campaigns and identify which platforms genuinely drive engaged visitors versus just clicks.
When a visitor clicks a link on another website that leads to your site, their browser includes a “Referer” header (yes, it is deliberately misspelled in the HTTP specification) in the request. This header contains the URL of the page they were on when they clicked the link. Your analytics plugin reads this header and records it as the traffic source for that visitor’s session.
There are some technical limitations to be aware of. HTTPS-to-HTTP transitions do not send referrer headers in most browsers (though this is rarely an issue in 2026 since most sites use HTTPS). Some browsers and privacy extensions strip referrer information. Some social media platforms use redirect URLs that obscure the original referrer. A good analytics plugin handles these edge cases by recognizing common redirect patterns from major platforms and categorizing the traffic correctly.
The practical value of referrer data is direct. If you write a guest post on another blog and it drives 500 visitors to your site over the following week, your referrer data shows this clearly. If a news site links to your content and sends a spike of traffic, you see exactly which article linked to you and how many visitors it sent. This information tells you which external relationships are worth investing in and which content topics attract attention from other publishers.
Most analytics discussions focus on aggregate data: total visitors, average session duration, bounce rate. These metrics are useful but limited. They tell you what happened in aggregate but not why. Session journey data fills this gap by showing you the specific path individual visitors take through your site.
A session journey shows you that a visitor arrived from Google, landed on your blog post about WordPress security, clicked an internal link to your tools page, spent 4 minutes reading it, then visited your pricing page and left. Another visitor arrived from a Twitter link, read one paragraph of your blog post, and left immediately. The aggregate bounce rate for that blog post might be 60%, but the session journeys reveal that 40% of visitors are engaging deeply and navigating to your commercial pages while 60% are leaving immediately. These are two completely different audiences with different needs.
Understanding session journeys helps you identify successful content paths, meaning the sequences of pages that lead to conversions, so you can make those paths easier to follow for future visitors. It also reveals dead ends: pages where visitors consistently stop and leave, suggesting that the page is missing a compelling next step or internal link.
Here is a practical workflow for using traffic source and journey data to improve your WordPress site. Start by reviewing your traffic source breakdown monthly. Identify which channels are growing and which are declining. For growing channels, look at which specific pages are receiving the most traffic from that channel and create more content in the same topic area. For declining channels, investigate whether the decline is due to algorithm changes, reduced posting frequency, or content becoming outdated.
Next, examine your referrer data. Identify the top 10 referring domains and assess whether they are one-time spikes or consistent sources. For consistent referrers, consider reaching out to build a deeper content relationship. For one-time spikes, analyze what type of content attracted the link and produce more content in that vein.
Finally, review session journeys for your most important pages, especially your homepage, your top landing pages, and your conversion pages. Identify the most common paths visitors take and ensure those paths are smooth. Add internal links where visitors commonly leave, and optimize pages that serve as dead ends.
A tool like NEXU WordPress analytics with complete traffic source analysis and session journey tracking provides all of this data in a single dashboard. The combination of referrer tracking, real-time session monitoring, and AI-powered reporting gives you the complete picture: where visitors come from, what they do on your site, and what you should do to improve both.
Complete traffic source tracking. Detailed referrer analysis. Individual session journey visualization. All the data you need to make informed growth decisions.







As a single mom running a blog between work and kid chaos, I don't have time for fluff. this guide cut through the noise and showed me exactly how to track where my visitors come from especially the ones from that guest post I did last month. Seeing those 500 visits broken down by what they actually did on my site (not just that they showed up) helped me focus on what's working. totally worth it just for the referrer data section alone
This guide totally changed how I look at traffic data. i've had a photography portfolio on WordPress for years, and I used to just check total visitor numbers like it was some kind of game score. But when I started breaking it down by source organic, social, direct and actually saw the paths people were taking, everything clicked
Hey everyone! As a nurse who runs a wellness blog on the side, I've read way too many dry analytics guides that make my eyes glaze over. this one's different it actually explains why tracking visitor journeys matters in plain English. the part about direct traffic revealing brand strength hit home for me. i always wondered why my site had spikes after local health fairs, and now I get it: people were typing my URL straight in because they remembered me! that's huge for planning content. No fluff, just actionable insights