Next-Level Code. Nexuvibe Style ...
Hrs
Min
Sec

There is a ceiling that almost every WordPress user sync implementation hits, and it always manifests the same way: the queue was working fine at moderate traffic levels, then something changed — a campaign launched, a product went viral, a large batch import ran — and the queue fell behind. Not catastrophically, not obviously, but steadily. An hour after the traffic spike, sync lag is 30 minutes. Four hours later it is three hours. By the next morning, customers are filing support tickets about access issues that should have resolved themselves automatically.
The ceiling is not a bug. It is an architectural constraint that manifests only at volume. The queue configuration that is perfectly adequate for 500 sync events per day is the wrong configuration for 50,000 per day. The cron settings that work smoothly on a medium-traffic site produce unbearable backlog on a high-traffic one. Batch sizes that balance load on a two-site network create timeouts on a ten-site network. These are not the same problems at different scales — they are qualitatively different engineering challenges that require different architectural responses.
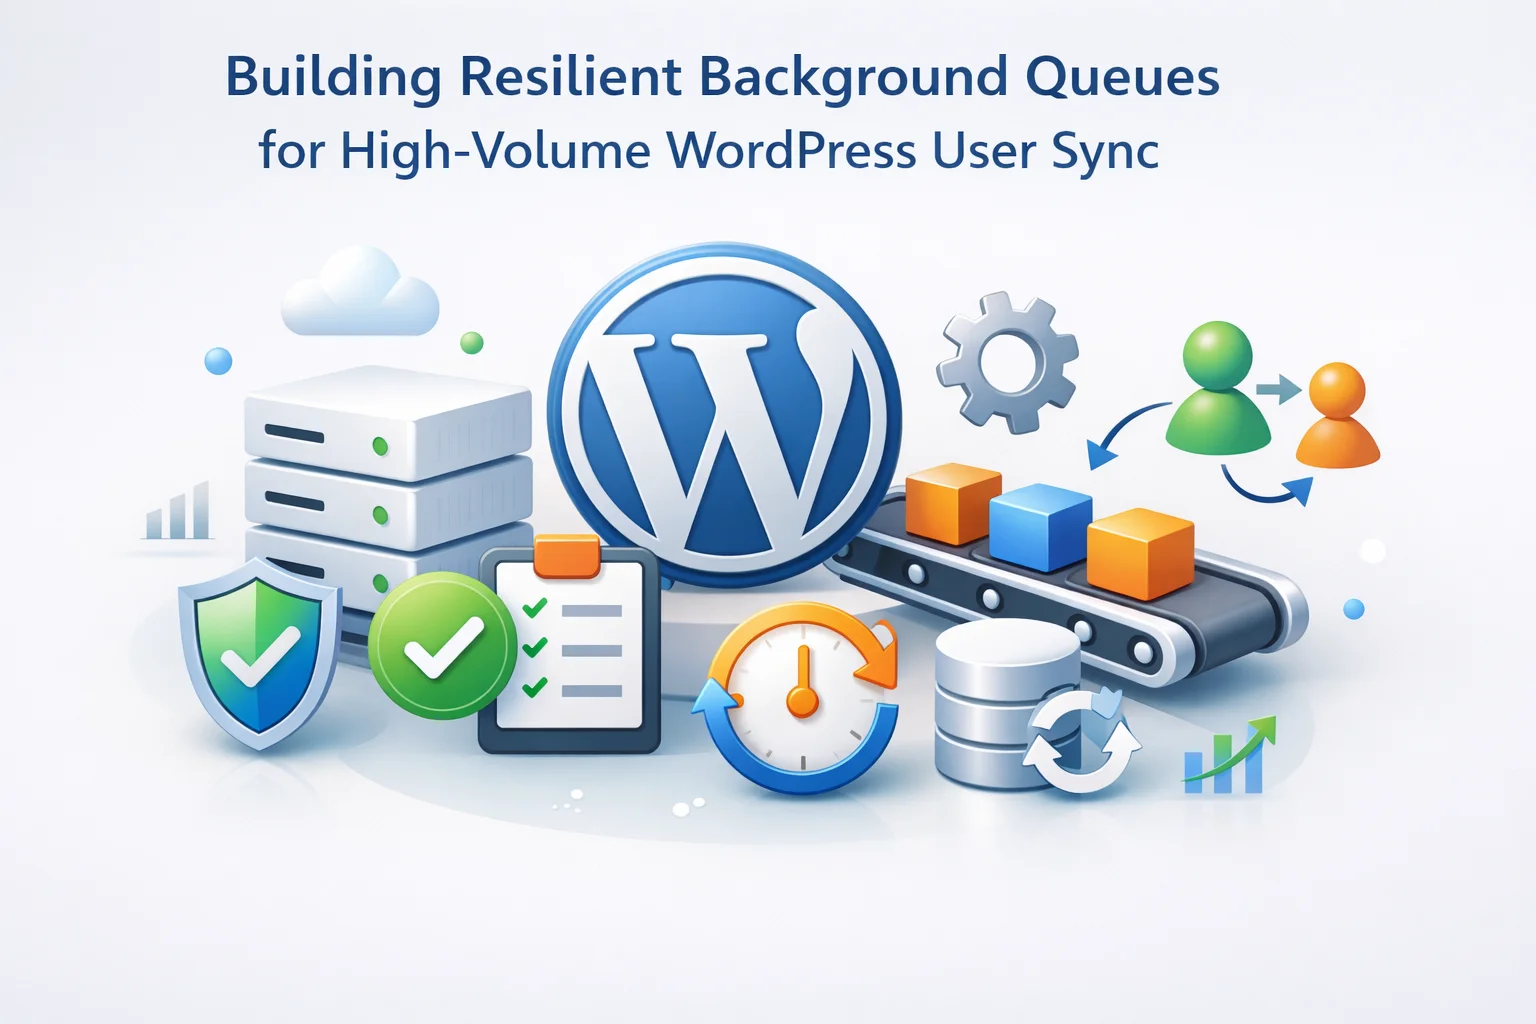
This guide covers the engineering of high-volume resilient background queues for WordPress user sync. It is a technical deep-dive intended for developers, DevOps engineers, and senior WordPress administrators who are building or maintaining sync infrastructure at scale. We cover the specific constraints of the WordPress cron system, the database-level issues that high-volume queues create, the architectural patterns that address them, and how WordPress high-volume user sync queue architecture is designed to handle these challenges in production environments.
“High volume” in this guide means networks processing more than 10,000 sync events per day consistently, or networks with peak traffic that can spike to that level during campaigns or product launches. If your network operates well below this threshold, most of this guide is preventive knowledge — useful for understanding the constraints before you hit them rather than after.
WordPress cron — officially called WP-Cron — is not a true system cron. It is a pseudo-cron that fires when a page on your WordPress site is visited. When a page request arrives at WordPress, the bootstrap process checks whether any scheduled cron events are due and, if so, triggers them in a non-blocking process that runs after the page response is sent. No page visits, no cron fires.
This architecture has a fundamental throughput ceiling. On most configurations, WP-Cron fires at most once per page load, and runs the entire batch within a single PHP execution. PHP execution has a maximum execution time (typically 30 to 120 seconds depending on host configuration). Within that window, the batch processor must complete its work or be terminated. For a low-volume queue processing 20 events per batch, this is fine. For a high-volume queue that needs to process 500 events per batch to keep up with event creation rate, the math does not work — the batch exceeds the execution time limit and is killed partway through.
batch_size × page_visits_per_second. If batch size is 20 events and the site receives 2 page visits per second, maximum throughput is 40 events/second or 144,000 events/hour. This sounds adequate until you realize: cron fires are not guaranteed on every page load (WP-Cron deduplicates concurrent fires), low-traffic periods may have only 0.1 page visits per second, and each event in the batch requires an outbound HTTP call to a sub-site that takes 0.5 to 2 seconds. The practical throughput is far lower than the theoretical maximum.
The solution for high-volume environments is to replace WP-Cron’s traffic-dependent triggering with a true system-level cron job that fires on a reliable schedule regardless of site traffic. On Linux-based hosting, this means adding a server-level crontab entry that calls the WordPress cron endpoint directly.
# Fire WordPress cron every minute, regardless of site traffic
* * * * * php /path/to/wordpress/wp-cron.php >/dev/null 2>&1

# Or via WP-CLI (preferred on managed hosts)
* * * * * wp cron event run --due-now --path=/path/to/wordpress >/dev/null 2>&1

# Disable WP-Cron's traffic-triggered mode in wp-config.php:
define( 'DISABLE_WP_CRON', true );
With DISABLE_WP_CRON set to true, the traffic-triggered cron firing is completely disabled. The system crontab takes over, firing every minute reliably. Queue processing becomes decoupled from site traffic entirely — your queue processes at consistent intervals during low-traffic periods at 3 AM just as reliably as during peak traffic at noon.
For managed hosting environments where server-level crontab access is not available, most managed WordPress hosts provide a built-in cron scheduling feature in their control panel. The WordPress WP Crontrol plugin is also useful for verifying that scheduled events are registering correctly and firing on schedule during setup and diagnostics.
A sync queue is fundamentally a database-intensive operation. Every event creation writes a row. Every batch pickup reads and locks rows. Every event completion updates a row. Every status check reads rows. On a high-volume network where thousands of events are created per hour and the queue processor runs every minute, these database operations accumulate rapidly and create contention that can degrade the performance of your entire WordPress installation — not just the sync queue.
The primary contention mechanism is table locking. When the queue processor begins a batch, it typically locks the queue table rows it is picking up to prevent duplicate processing. If this lock is held for the duration of the entire batch (which can be seconds to minutes depending on batch size and sub-site response time), new event insertions from the event hooks are blocked for that duration. The result is event creation latency — user registrations appear to complete normally from the user’s perspective but their sync events are not being inserted into the queue during the lock window.
A queue implementation that locks the entire queue table during batch processing prevents concurrent event insertions. A better approach uses SELECT ... FOR UPDATE with row-level locking on InnoDB tables, which locks only the specific rows being processed rather than the entire table. New event insertions can continue unimpeded while the batch processor works on the rows it has claimed.
SHOW TABLE STATUS LIKE 'wp_queue_table'.Queue table queries follow predictable patterns: fetch pending events (filter by status), fetch events for a specific user (filter by user_id), fetch events for a specific destination site (filter by site_id). Without indexes on these columns, every batch pickup is a full table scan. On a queue table with 100,000 rows, a full table scan for pending events is measurably slower than an indexed lookup. At minimum, the queue table should have composite indexes on (status, created_at) and (user_id, status).
EXPLAIN SELECT * FROM wp_nus_queue WHERE status='pending' ORDER BY created_at LIMIT 50 and verify the output shows type: ref or range, not ALL.Completed events accumulate in the queue table and degrade query performance over time. A queue that has been running for six months without pruning may have millions of completed event rows that every pending-event query must skip. Configure automatic pruning to delete completed events older than your defined retention period (typically 30 to 90 days for the audit trail) during a low-traffic maintenance window. This keeps the table size bounded and queries fast regardless of how long the queue has been running.
Batch size is the single most impactful configuration parameter in a sync queue system, and it is also the most commonly set incorrectly — either too small (producing unnecessary overhead per event) or too large (producing timeouts and half-processed batches). The right batch size is not a guess — it is a calculation based on measurable variables from your specific environment.
// Variables you need to measure:
$max_execution_time     = ini_get( 'max_execution_time' ); // typically 30–120s
$avg_event_processing_time = 0.8;  // seconds per event (measure via logging)
$safety_margin          = 0.7;   // use 70% of available time
$num_sub_sites          = 5;     // number of connected sub-sites

// Per-event time scales with connected sub-sites:
// Each event requires one API call per destination sub-site
$effective_time_per_event = $avg_event_processing_time * $num_sub_sites;

// Maximum safe batch size:
$max_batch_size = floor(
    ( $max_execution_time * $safety_margin ) / $effective_time_per_event
);

// Example: 60s max_execution, 0.8s/event, 5 sub-sites
// = floor((60 * 0.7) / (0.8 * 5)) = floor(42 / 4) = 10 events per batch

// Required cron frequency to keep up with event creation rate:
$events_per_hour       = 1000;  // measure your actual creation rate
$batches_needed_per_hour = ceil( $events_per_hour / $max_batch_size );
$cron_interval_seconds  = floor( 3600 / $batches_needed_per_hour );
The critical variable in this calculation that most administrators do not measure is $avg_event_processing_time — the actual wall-clock time required to process one sync event end-to-end, including the outbound API call to the sub-site, the sub-site’s processing time, and the response round-trip. This variable varies significantly with sub-site hosting quality, network latency between servers, and sub-site load. Measure it with real data before calculating batch size, not with an assumed value.
A second important consideration: if events can be processed in parallel — sending the same event to multiple sub-sites concurrently rather than sequentially — the effective time per event is the time to the slowest sub-site response, not the sum of all sub-site response times. Parallel processing can increase throughput by a factor equal to the number of sub-sites, but requires a multi-threaded or async HTTP implementation that is more complex to build correctly.
A failed sync event should not be discarded. It should be retried — but not immediately, not infinitely, and not at the same rate as its initial attempt. The retry logic design is what separates a resilient queue from a brittle one.
When a sync event fails because a sub-site is temporarily unavailable, retrying it immediately produces the same failure. Retrying it again and again in rapid succession contributes to the database read/write load and the outbound HTTP call load without making any progress. Exponential backoff solves this by increasing the delay between retry attempts: first retry after 1 minute, second after 5 minutes, third after 30 minutes, fourth after 2 hours, fifth after 8 hours. Each failure increases the wait time exponentially, giving the destination system time to recover while reducing the retry-induced load on the queue.
// Exponential backoff delay calculation
function get_retry_delay( $attempt_number ) {
    $base_delay  = 60;   // 60 seconds base
    $multiplier  = 5;    // multiply by 5 each attempt
    $max_delay   = 28800; // cap at 8 hours
    $jitter      = rand( -30, 30 ); // ±30s jitter to spread retries

    $delay = min(
        $base_delay * pow( $multiplier, $attempt_number - 1 ),
        $max_delay
    );
    return $delay + $jitter;
    // Attempt 1: ~60s, Attempt 2: ~300s, Attempt 3: ~1500s...
}
Infinite retries are not a resilience strategy — they are a liability. An event that has failed 20 times over three weeks is almost certainly failing due to a persistent condition (corrupted record, permanently offline sub-site, API key invalidation) that automatic retry will never resolve. Setting a maximum retry limit prevents the queue from accumulating permanent-failure events that never process and consume processor attention on every batch run. Five to ten maximum retries with exponential backoff covers the vast majority of transient failures; beyond that, human intervention is required.
The right max retry count depends on your exponential backoff schedule. With the schedule above, five retries span approximately 8 hours of total delay — sufficient to cover overnight maintenance windows and most sub-site outages. Ten retries span roughly four days — appropriate if your sub-site hosting has documented maintenance windows longer than eight hours.
Events that exhaust their retry budget should be moved to a dead-letter state — marked as permanently failed but preserved in the queue with their full context (event type, user ID, failure reason, retry history). They should not be silently deleted. The dead-letter entries serve three purposes: they provide the data needed for manual recovery decisions, they alert administrators to persistent infrastructure problems via the monitoring dashboard, and they preserve the audit trail for compliance and investigation purposes.
The weekly review of dead-letter entries is one of the most valuable operational practices for high-volume queue operators. A cluster of dead-letter entries for the same sub-site points to a connectivity or authentication issue. A cluster for the same user ID points to a record-level data problem. Neither is visible in aggregate queue health metrics but both are immediately obvious when dead-letter entries are reviewed.
When cron fires every minute and each batch takes longer than a minute to process, overlapping batch executions can occur. Two cron processes both pick up the queue at the same time, both claim the same pending events, and both attempt to process them — resulting in duplicate API calls to sub-sites and potentially duplicate user updates. At best this produces extra load. At worst it creates race conditions in sub-site data.
The standard solution is a process lock — a mechanism that prevents a second batch processor from starting if one is already running. In WordPress, this is typically implemented via a transient that is set at the start of batch processing and deleted at the end. Any cron trigger that finds the lock transient already set exits immediately without starting a new batch.
function run_sync_queue_batch() {
    $lock_key    = 'nus_queue_processing_lock';
    $lock_timeout = 300; // 5 minutes — longer than max expected batch time

    // Attempt to acquire lock using atomic transient operation
    if ( get_transient( $lock_key ) ) {
        return; // Another process is running — exit cleanly
    }

    // Set lock with expiry as safety net against stuck processes
    set_transient( $lock_key, 1, $lock_timeout );

    try {
        process_pending_events(); // actual batch processing
    } finally {
        delete_transient( $lock_key ); // always release lock
    }
}
finally block does not execute and the lock is never released. Without the transient expiry, the queue would stop processing indefinitely. The $lock_timeout is the safety net — if the lock transient expires after 5 minutes, the next cron trigger can acquire it and resume processing. Set this value to comfortably exceed your longest expected batch processing time but not so long that a crash causes significant queue delay.
Before a high-volume campaign or product launch that will spike your user registration rate, capacity planning tells you whether your queue infrastructure can handle the anticipated load — and what specifically needs to change if it cannot. The following framework produces a concrete capacity assessment.
The following table summarizes the configuration parameters that matter most for high-volume queue resilience, with recommended values based on different volume tiers and the rationale for each.
A high-volume queue that is properly configured does not require constant attention — it processes reliably, recovers from transient failures automatically, and alerts you when something requires human review. The engineering investment in getting the configuration right scales logarithmically with the volume it handles: the same architecture that handles 10,000 events per day handles 100,000 per day with only batch size and cron frequency adjustments.
Nexu User Sync’s high-volume WordPress background queue with configurable batch sizing provides the process locking, exponential backoff retry logic, dead-letter handling, and queue table management that high-volume networks require. The cron integration, monitoring signals, and configurable batch size give you the controls to tune the system for your specific event volume and infrastructure constraints without custom development.
Nexu User Sync provides the batch sizing controls, retry logic, process locking, and queue monitoring that high-volume WordPress sync networks require — tunable for your specific event volume and infrastructure without writing a line of custom queue code.






I've built user sync systems for WordPress before, and this guide totally called out something I only learned the hard way: database contention isn't some big dramatic crash it's that slow, sneaky problem you don't even notice at first. Everything seems fine, then boom, your queue's lagging by hours and you're stuck playing detective. the part about batch sizing and how every single event writes a row? that's the stuff most guides just skip over.
I've been testing this with about 20 events per batch, and it's working fine so far. But how well does "writing a row for every event" actually hold up at scale like if you're pushing 10k events?
Finally found a guide that actually explains why my user sync queue kept falling behind during traffic spikes. Total lightbulb moment no wonder my 20 event batches couldn't keep up when visits spiked.