Next-Level Code. Nexuvibe Style ...
Hrs
Min
Sec

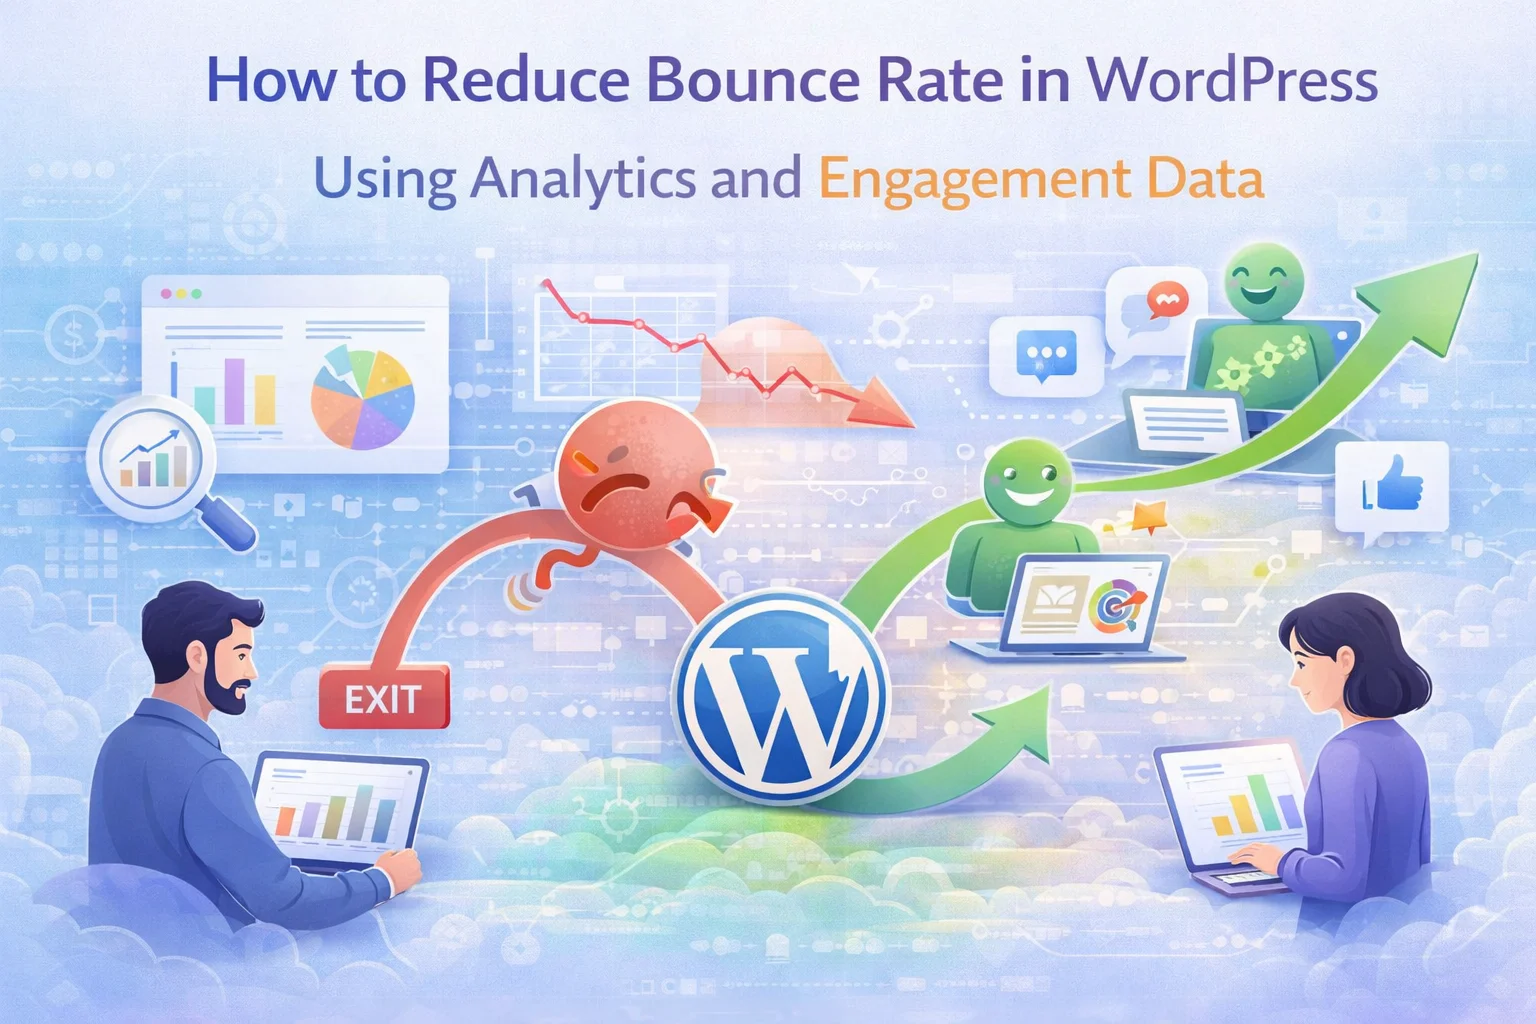
Most advice about reducing bounce rate starts with vague suggestions: improve your content, make your site faster, write better headlines. That advice is not wrong, but it is useless without knowing which pages have the problem, why visitors are leaving those pages, and whether the bounce is actually hurting your business. A blog post where someone reads the entire article and then leaves still registers as a bounce in most analytics tools. That is very different from a landing page where someone takes one look and closes the tab.
The difference between productive bounce rate optimization and wasted effort comes down to data. You need to see exactly which pages have abnormal bounce rates, what the visitors on those pages were doing before they left, how long they actually stayed, and what device, location, and traffic source brought them there. Without that data, you are guessing. With it, every fix you make is targeted and measurable.
This guide walks through a practical, data-driven approach to diagnosing and reducing bounce rate on WordPress sites. We will use NEXU Real-Time AI Analytics for WordPress engagement tracking and bounce rate analysis to illustrate the process, but the analytical framework applies regardless of which tool you use.
Bounce rate is the percentage of sessions where a visitor lands on a page and leaves without triggering another request to the server. In traditional analytics, this means they visited one page and then exited. The metric was originally designed for multi-page websites where a single-page visit generally meant something went wrong: the visitor did not find what they wanted, or the page did not engage them enough to continue browsing.
The problem is that this definition does not account for intent. Someone who reads your entire 2,000-word blog post over six minutes and then leaves has “bounced.” Someone who lands on your homepage, gets confused by the layout, and closes the tab after three seconds has also “bounced.” These are fundamentally different behaviors, and treating them as the same metric leads to bad decisions.
Google recognized this limitation and introduced “engagement rate” in GA4, which considers a session engaged if it lasts longer than 10 seconds, includes a conversion event, or involves more than one page view. This is a step forward, but it is still a blunt instrument. What you actually need is the ability to look at bounce rate in context: per page, per traffic source, per device, and alongside time-on-page data that tells you whether the “bounce” was a satisfied reader or a frustrated visitor.
Your site-wide bounce rate is almost irrelevant. It is an average across pages with completely different purposes, traffic sources, and visitor intent. A blog post naturally has a higher bounce rate than a product category page. Optimizing for a lower site-wide average will lead you to waste time on pages where bouncing is normal and ignore pages where it is a real problem.
Start by looking at bounce rate at the individual page level, sorted by traffic volume. You are looking for pages that meet two criteria simultaneously: they receive significant traffic, and their bounce rate is notably higher than comparable pages on your site. A landing page with a 78% bounce rate when your other landing pages average 55% is a clear signal. A blog post with a 72% bounce rate when your blog average is 68% is probably not worth investigating.
Focus your effort on three page types where high bounce rate has a direct business impact: landing pages for paid campaigns (where every bounce is wasted ad spend), product and service pages (where bounces represent lost revenue), and key conversion funnel entry points like pricing pages or signup pages. Blog posts and informational content pages can have high bounce rates without it being a problem, as long as visitors are actually reading the content.
Once you have identified the pages with problematic bounce rates, the next step is understanding why visitors leave. This is where most optimization efforts fail because they skip the diagnosis and jump straight to generic fixes. But a page where visitors bounce after 2 seconds has a completely different problem than a page where visitors bounce after 45 seconds. The data tells you which scenario you are dealing with.
When visitors leave within seconds, the cause is almost always technical or expectational. The page loaded too slowly, especially on mobile. The content above the fold did not match what the visitor expected based on the link or search result that brought them. The page has intrusive popups or interstitials that triggered an immediate exit. Check your page load times by device type and compare the page’s meta title and description against its actual above-the-fold content.
This is the most actionable category. The visitor stayed long enough to scan the page but did not find a reason to go deeper. Common causes include weak or unclear value propositions, content that does not address the visitor’s specific question, poor visual hierarchy that makes the page hard to scan, and lack of a clear next step or call to action. This is where content and layout improvements have the most impact.
A visitor who spends two or three minutes on a page and then leaves is often a satisfied visitor. They read the content, got their answer, and moved on. For blog posts and informational pages, this is not a problem. For conversion-oriented pages, it might mean the content engaged them but the call to action was not compelling enough, or there was no natural next step presented. The fix here is usually adding relevant internal links and CTAs, not rewriting the content.
A page can have a perfectly acceptable bounce rate from organic search traffic and a terrible bounce rate from social media traffic. If you only look at the combined number, you might try to fix the page when the real problem is the traffic source. Segmenting bounce rate by source reveals whether the issue is the page itself or a mismatch between the audience and the content.
The most common pattern is this: organic search traffic tends to have the lowest bounce rate because the visitor actively searched for something related to the page content. Social media traffic tends to have the highest bounce rate because the visitor was browsing casually and may not have had strong intent. Referral traffic and direct traffic fall somewhere between. If your page has a high bounce rate that is entirely driven by one traffic source, the fix is not changing the page. The fix is either adjusting how you promote the page on that channel or accepting that the traffic from that source has lower engagement potential.
Device segmentation is equally important. A page that works perfectly on desktop but has a 90% bounce rate on mobile almost certainly has a responsive design issue. Check the page on an actual mobile device, not just a browser resize. Look for text that is too small to read, buttons that are too close together, images that break the layout, or content that requires horizontal scrolling. According to Google’s Core Web Vitals documentation, mobile performance directly impacts both user experience and search rankings.
Once you have diagnosed the cause using the data-driven approach above, the fixes become specific and testable. Each of these five optimizations targets a common bounce rate cause and can be validated with before-and-after analytics data.
Look at the search queries bringing traffic to your high-bounce pages. If visitors searching for “how to install WordPress” are landing on a page about WordPress hosting plans, the bounce is inevitable no matter how good the page is. Either update the page content to match the actual search intent, or adjust your SEO strategy to target the queries that match the page’s purpose. Use your analytics content data to see which pages rank for which terms and whether there is a mismatch.
Visitors decide whether to stay or leave within the first few seconds of seeing a page. The content visible without scrolling needs to immediately communicate what the page offers and why it is relevant to the visitor. For pages with high instant-bounce rates, rewrite the headline and opening paragraph to directly address the visitor’s likely question or need. Remove anything above the fold that is not serving this purpose, including unnecessary banners, ads, or decorative elements that push the real content down.
For pages with long-duration bounces where visitors clearly engaged with the content but then left, the fix is usually adding relevant next steps. This means contextual internal links within the content itself (not just a sidebar or footer), a clear call to action that follows logically from what the visitor just read, and “related content” links that match the visitor’s likely next question. The key word is “contextual.” A generic “Read More” section at the bottom of every page is less effective than a specific recommendation embedded in the content at the point where the visitor’s interest is highest.
If your device-segmented data shows mobile bounce rates significantly higher than desktop, the page likely has mobile usability issues that are invisible in desktop testing. Common culprits include text that is too small on mobile screens, touch targets that are too close together, slow-loading images that are not properly sized for mobile, and layout elements that cause horizontal scrolling. Fix these issues on your highest-traffic pages first, then validate the improvement using your analytics device breakdown.
Page speed has a direct, measurable relationship with bounce rate. Research consistently shows that each additional second of load time increases the probability of a bounce. If your real-time analytics show that certain pages have both high bounce rates and visitors from regions with slower internet connections, page speed optimization should be your first intervention. Compress images, defer non-critical JavaScript, use a CDN, and eliminate render-blocking resources. Then use your analytics to verify that the faster page actually retains more visitors.
Most analytics approaches treat bounce rate as a historical metric. You look at last month’s data, identify a problem, fix it, and then wait another month to see if it improved. This cycle is slow and makes it impossible to connect specific changes to specific outcomes when multiple changes are happening on a site simultaneously.
Real-time analytics changes this dynamic. When you publish a new page or make a significant change to an existing one, you can watch visitor behavior in real time. You can see whether visitors are staying or leaving immediately, how they are interacting with the updated content, and whether the change produced the engagement improvement you expected. This feedback loop is hours instead of weeks.
This is particularly valuable when you launch paid campaigns. Instead of spending your daily budget and then discovering the next day that 85% of your paid traffic bounced, you can see the bounce pattern forming within the first hour and pause or adjust the campaign before the budget is wasted. For campaigns driving traffic to a specific landing page, real-time monitoring turns every dollar of ad spend into a usable data point.
Every bounce rate optimization should be treated as a testable hypothesis. Before making a change, document the current bounce rate for the specific page, segmented by traffic source and device. After the change, give it enough time to accumulate statistically meaningful data, usually two to four weeks depending on traffic volume. Then compare the same segments.
The reason for segmenting is that overall bounce rate can be misleading. If you improved mobile bounce rate by 15 percentage points but your organic traffic mix shifted during the same period, the overall number might not show the improvement. Segment-level comparison isolates the effect of your change from other variables.
A tool that generates AI-powered WordPress analytics reports with engagement trend analysis can automate this comparison. Scheduled reports that cover the same metrics week over week create a natural record of improvement over time. Instead of manually pulling data for each comparison, you have a running performance record that shows whether your optimization efforts are moving the engagement metrics in the right direction.
The goal is not to get your bounce rate to zero. That is neither possible nor meaningful. The goal is to understand what your bounce rate data is telling you about visitor experience on specific pages, and to fix the pages where bouncing represents a genuine loss of business value. A blog with a 65% bounce rate where readers are spending four minutes per session is working perfectly. A product page with a 75% bounce rate where visitors leave in eight seconds has a problem that is costing you money every day.
The data-driven approach outlined in this guide gives you the framework: identify the pages that matter, diagnose the cause using behavioral and segmentation data, apply targeted fixes, and measure the results. Every step depends on having analytics data that is accurate, granular, and accessible in real time.
NEXU Analytics with per-page engagement tracking, device segmentation, and real-time visitor monitoring provides exactly that level of data for WordPress sites. Combined with AI-generated reports that highlight engagement trends automatically, it gives you the diagnostic tools to turn bounce rate from a vague concern into a specific, solvable problem.
Per-page engagement metrics. Device and source segmentation. Real-time visitor monitoring. AI-powered trend reports. Everything you need to diagnose and fix bounce rate issues on your WordPress site.






Finally got some real data to work with. not perfect, but way better than guessing.
This guide totally changed how I think about bounce rates. I used to assume a high rate was always bad, but now I see it really depends on the page
Saved my cart page!