Next-Level Code. Nexuvibe Style ...
Hrs
Min
Sec

Most WooCommerce affiliate program operators look at their data the wrong way. They check the dashboard occasionally, notice how much commission was earned this month, compare it to last month, and draw a vague conclusion about whether the program is doing well or poorly. This approach leaves the majority of the program’s diagnostic value untouched. The same data, analyzed differently, reveals which affiliates are underperforming relative to their audience size, which product categories affiliates are most effectively promoting, whether a commission rate change improved affiliate activity, and which months of the year the program generates the most return on investment.
The analysis that makes affiliate programs significantly better is not complex — it does not require a data scientist or a business intelligence tool. It requires pulling the right data from your affiliate plugin, running a handful of calculations in a spreadsheet, and knowing which findings should trigger which program decisions. This is the workflow this guide covers.
The examples throughout use the data tabs available in Affiliate Engine, a WooCommerce affiliate management and analytics plugin — the Affiliates, Referrals, Visits, and Payouts tabs — but the analytical framework applies to any WooCommerce affiliate plugin that provides exportable data.
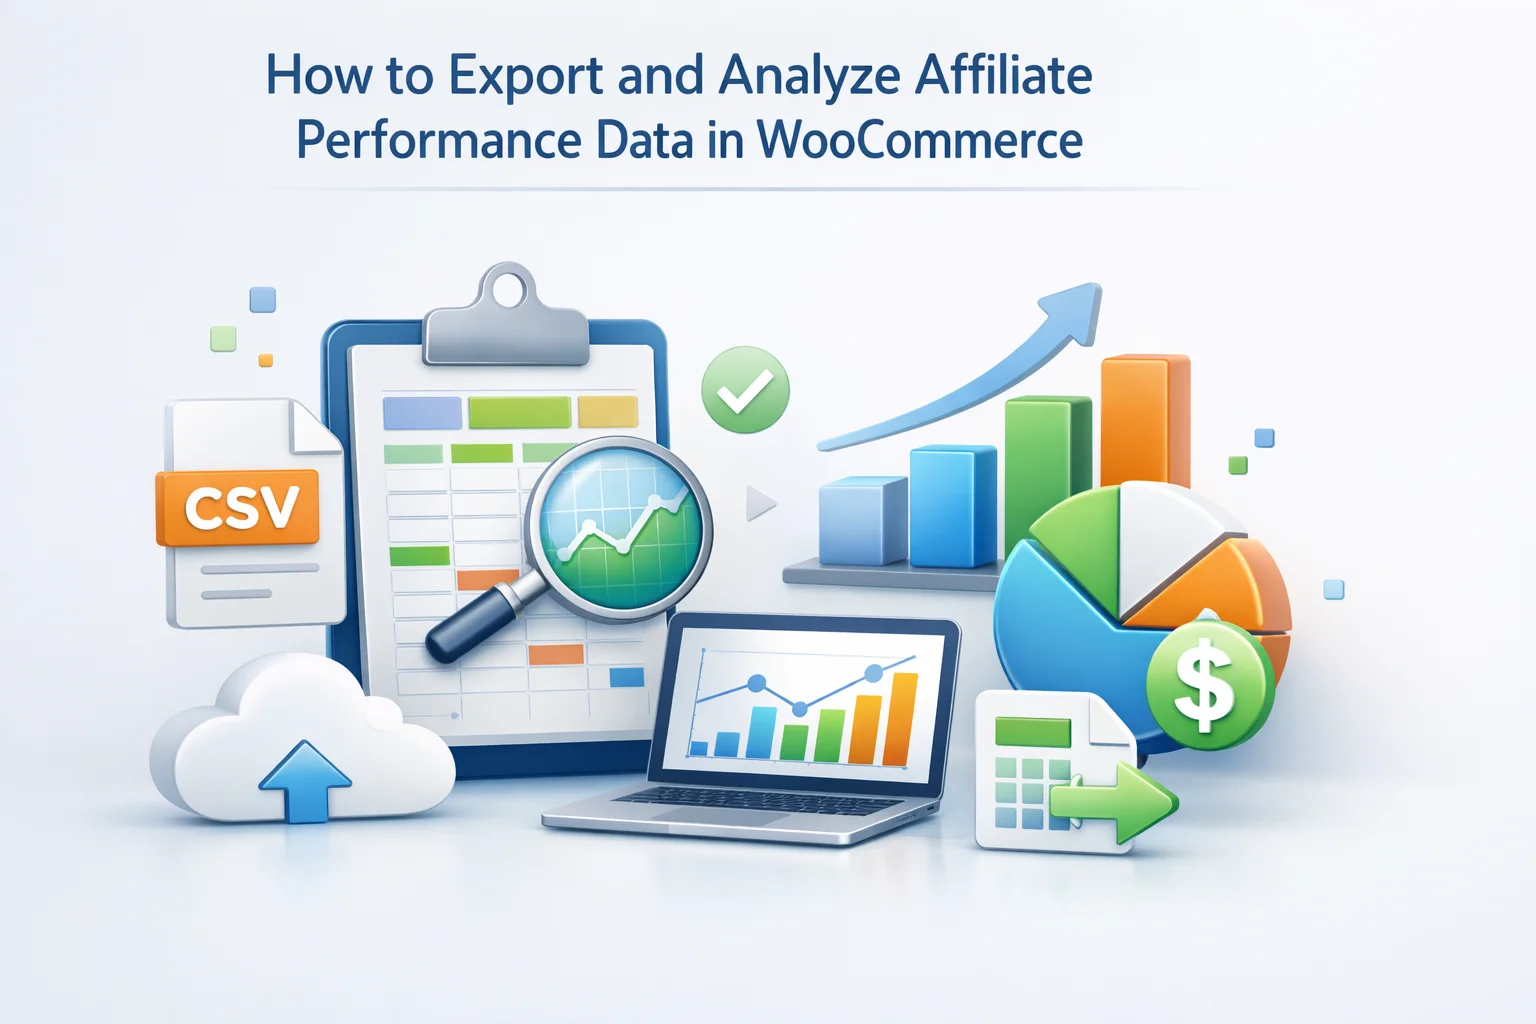
A complete affiliate performance analysis requires four data exports, each from a different tab in your affiliate plugin dashboard. Export all four before beginning analysis — having them in separate spreadsheet sheets lets you run cross-tab calculations that reveal patterns not visible in any single export.
These six metrics cover the dimensions of affiliate performance that matter most: how many of your affiliates are actually active, how efficiently each one converts traffic to revenue, the cost of each affiliate-acquired customer, the quality of individual affiliates’ promotional efforts, and the overall ROI of the channel. Each metric answers a specific question and drives a specific type of program decision.
The percentage of approved affiliates who have ever generated at least one commission. This is your program’s most important health metric. An activation rate below 40% means more than half your approved affiliates have never promoted — indicating an onboarding problem, a creative friction problem, or a mismatch between your affiliate recruitment and the types of people who will actually promote your products.
The percentage of clicks from an affiliate’s links that result in a completed purchase. This reveals traffic quality — not all affiliate traffic is equal. An affiliate with 200 clicks and 8 sales (4% conversion) is delivering significantly more valuable traffic than one with 400 clicks and 4 sales (1% conversion). The first affiliate’s audience is pre-qualified; the second’s is not. Identifying your high-conversion affiliates lets you invest more relationship-building effort in the types of creators who generate these results.
The average value of orders generated by each affiliate’s referrals. An affiliate whose referred customers spend an average of $90 per order is generating roughly twice the revenue per referral as one whose referred customers average $45. This metric identifies which affiliates are attracting premium buyers versus deal-seekers. High-AOV affiliates often use content that educates the buyer about the product’s value rather than content that leads with discounts — a style worth understanding and replicating in your creative briefs.
The average revenue generated per active affiliate in a given period (usually monthly or quarterly). This is the single most useful program-level benchmark metric. Tracking RPAA over time tells you whether your program’s quality is improving — are you getting more revenue per affiliate as you improve onboarding, creatives, and partner support? A rising RPAA indicates that your system improvements are working. A flat or declining RPAA despite growing total affiliate count indicates you are adding quantity without improving quality.
The average cost to acquire one customer through the affiliate channel. This is your most important comparison metric for channel ROI — compare it directly to your paid advertising CPA to understand relative channel efficiency. For most WooCommerce stores, affiliate CPA is significantly lower than paid ad CPA because affiliate commission is a percentage of revenue rather than a fixed cost per click. Calculate this both as a program average and per individual affiliate to identify which affiliates are delivering the best CPA.
The percentage of affiliate-driven revenue that is returned as commission. This should roughly equal your configured commission rate — if it significantly exceeds your configured rate, there is a calculation problem (commissions being calculated on the wrong base, shipping or taxes being included). If it matches, your commission structure is working as designed. Track this quarterly to detect any configuration drift, especially after store changes that affect order structure, discount behavior, or tax calculation.
A per-affiliate scorecard combines several metrics into a single ranked view that makes tier management, recruitment prioritization, and re-engagement decisions straightforward. Build this in a spreadsheet using the Affiliates and Referrals exports, with one row per affiliate and columns for each metric.
Looking at this scorecard, several actionable insights emerge immediately. Sarah is a clear Partner tier candidate — high conversion rate, strong AOV, highest revenue. Priya has excellent conversion rate (7.6%) and AOV ($95) but low visit volume — she may be under-promoting; a targeted outreach message about a new campaign could unlock more volume from a clearly high-quality affiliate. Jake has high traffic but poor conversion — his audience may not be well-matched, or he may be leading with a discount message that attracts browsers. Tom is generating a lot of traffic with almost no conversion — this pattern usually indicates audience mismatch and warrants a direct conversation or removal consideration.
Beyond per-affiliate analysis, the referrals export enables program-level trend analysis that reveals how the channel is performing over time and which external factors affect its output.
Group your referrals export by month and chart total referral count and total referred revenue per month over the last 12 months. The seasonal pattern that emerges tells you when affiliate activity is naturally high (and should not be credited to campaign interventions) versus when it is naturally low (and when campaigns or increased creator outreach would have the most impact). For most consumer product stores, Q4 shows a natural spike — knowing this baseline prevents over-attributing Q4 performance to specific program changes made in autumn.
If your referrals export includes the attribution method column, calculate what percentage of referrals are attributed via cookie versus coupon code. A very high coupon proportion (over 70%) suggests your affiliates are heavily promoting to social media audiences where cookie tracking does not work — and that your cookie-only commission data may be undercounting total affiliate impact. A very low coupon proportion suggests your affiliates are not actively using their codes in social content, which is a creative briefing opportunity.
Calculate RPAA (Revenue per Active Affiliate) for each quarter over the last four quarters. If this number is growing, your program improvements — better onboarding, better creatives, tier structures — are working. If it is flat despite growing total affiliate count, you are adding affiliates faster than you are improving per-affiliate quality. If it is declining, you may be diluting your quality affiliate base with lower-quality approvals. This single trend is the most reliable indicator of whether your program management efforts are having a measurable effect.
Rather than running ad-hoc analysis whenever a question arises, build a structured quarterly analysis routine that produces four specific outputs — each driving a specific set of program decisions. The routine takes roughly 90 minutes and replaces hours of reactive troubleshooting over the following quarter.
The quarterly routine produces four concrete outputs that replace vague impressions of program performance with specific, actionable lists and decisions. Every program decision — rate changes, tier promotions, affiliate removal, creative updates, outreach campaigns — should trace back to a specific data finding from this routine rather than intuition or anecdote.
Affiliate Engine’s WooCommerce affiliate performance analytics and data export plugin provides the exportable data from the Affiliates, Referrals, Visits, and Payouts tabs that this analysis framework requires — with per-affiliate records that include the attribution method, order value, commission amount, and visit data needed to calculate every metric in this guide.
Affiliate Engine provides exportable Affiliates, Referrals, Visits, and Payouts data with the per-record detail needed to calculate all six core performance metrics and build the per-affiliate scorecard that drives quarterly program decisions.





Hey everyone! i just picked up this guide to help a friend step up their WooCommerce affiliate strategy, and honestly, it's a really helpful. the way it explains analytics is so straightforward no confusing jargon or needing a degree in data science. Just real, actionable steps to see which affiliates are actually bringing in sales and where to put your energy. if you're running an affiliate program, this is the kind of no nonsense advice that actually helps. totally worth it!
Got the guide makes sense that dropping RPAA means weaker affiliates
This guide is 12 minutes of fluff. Expected actionable metrics, got vague "check your dashboard" advice. Waste of time for devs who need real analysis workflows.
Hey, this guide totally skips over jobs, and I just lost hours dealing with half finished exports.