WordPress Sync Queue Monitoring & Failure Recovery
What Happens When Your User Sync Queue Fails
(And How to Monitor It)
A silent sync queue failure is one of the worst problems a WordPress multi-site network can have — because you do not know it happened until a customer complains. This guide covers every failure mode, what it costs, and how to build a monitoring setup that catches problems before users do.
14 min read
Updated 2026
Operations & Monitoring Guide
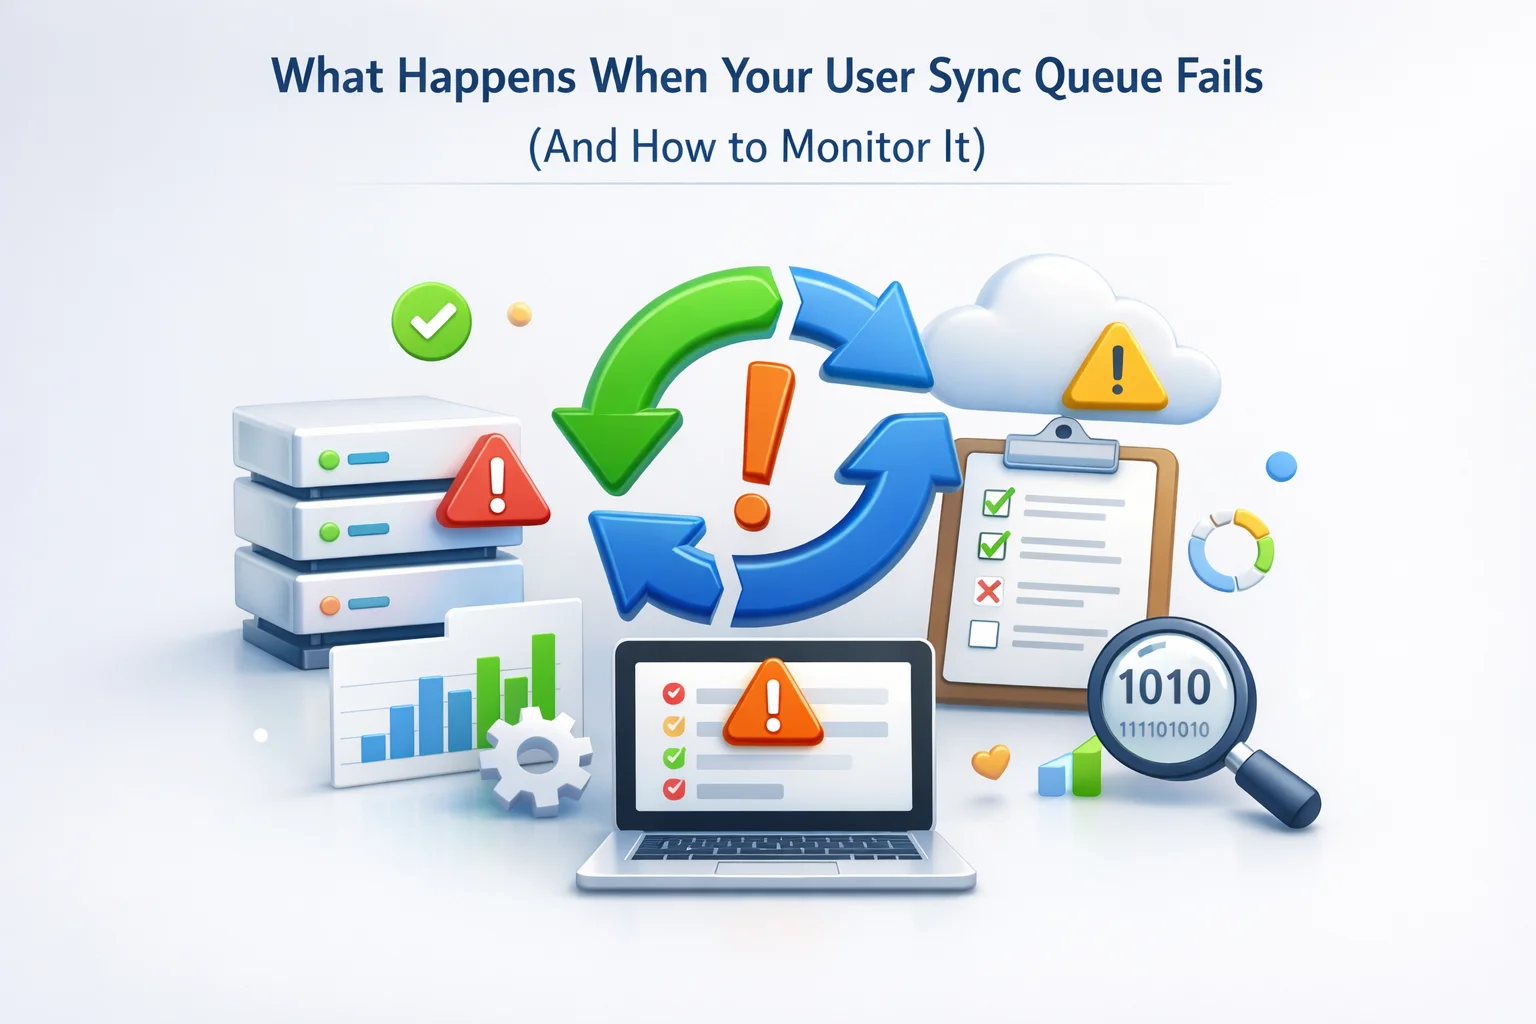
A failed sync queue is a peculiarly quiet kind of problem. Unlike a site outage — where users immediately know something is wrong and your monitoring alerts within minutes — a stuck or failing sync queue produces no visible error. Your WordPress sites load normally. Your admin panel looks fine. Users can browse, add to cart, and check out. Everything appears healthy. Meanwhile, beneath the surface, user registrations are piling up unsynced, password changes are not propagating, profile updates are accumulating in a queue that stopped processing hours or days ago, and customers on your connected sites are operating on stale data they do not yet know is wrong.
The first sign of the problem usually arrives as a support ticket. Someone cannot log in on a connected site. Someone’s shipping address is wrong. Someone registered yesterday but still cannot access the members area. By the time you receive that ticket and trace the problem back to the queue, the failure may have been silently accumulating for a significant window of time. Depending on your queue’s retry and persistence behavior, some of that data may be unrecoverable.
This guide is about not being in that position. It covers every meaningful failure mode that can affect a WordPress user sync queue, what each failure looks like from the inside, what data it puts at risk, how to detect it before customers do, and how to recover cleanly when it does occur. We cover this in the context of how WordPress multi-site user sync with queue monitoring and recovery is designed to handle these scenarios, but the diagnostic and monitoring framework applies broadly.
This is a guide for administrators who have already implemented user sync and want to operate it with professional-grade reliability, not just set it up and hope for the best.
What this guide covers
→How a user sync queue works and what “failure” actually means in each specific mode.
→The seven distinct failure modes — from total queue stalls to silent individual record failures.
→What data is at risk in each failure mode and for how long before the window closes.
→The monitoring signals that detect queue problems before they reach customer impact.
→Step-by-step recovery procedures for each failure type — including how to handle backlog safely.
→A monitoring checklist you can implement today to catch failures before users notice them.
How a user sync queue works: the foundation you need to understand failures
Before you can diagnose or monitor queue failures, you need a clear mental model of how the queue is supposed to work when everything is healthy. A sync queue is not a direct pipe that immediately pushes data from one site to another. It is a buffer and a scheduler — a system that decouples the event that triggers a sync from the actual transmission of data.
When a user event occurs on the master site — a registration, a profile update, a password change, a role modification — the sync plugin does not immediately fire an API request to every connected sub-site. Instead, it creates a queue entry: a database record that describes the event, the user it affects, the destination sites it needs to reach, and the timestamp of when it was created. The queue processor, which runs as a scheduled WordPress cron job, then picks up pending queue entries and processes them in batches, making the actual API calls to connected sites and updating the queue entry’s status to reflect the outcome.
Event occurs
User registers, updates profile, or changes password on master site
Queue entry created
Event is recorded as a database row with status “pending” and origin timestamp
Cron processes batch
WordPress cron picks up pending entries, fires API calls to sub-sites, marks entries complete or failed
This architecture has significant advantages — it decouples sync from user-facing response times, handles sub-site downtime gracefully, and provides a natural audit trail. But it also introduces a dependency chain with multiple points of failure. The queue can fail at the event creation step, at the cron scheduling step, at the API call step, or at the result recording step. Each failure point produces a different symptom and requires a different response.
WordPress cron — the scheduler that drives queue processing — is a pseudo-cron system. Unlike a true system-level cron, WordPress cron is triggered by site visits. If no one visits your master site for an extended period, cron does not fire, and the queue does not process. On low-traffic sites or during overnight hours, this can cause significant processing delays that look like queue failures from the outside. Understanding this distinction is essential for diagnosing apparent queue problems on sites with variable traffic patterns.
The seven failure modes: what each one is and what it puts at risk
1
Complete queue stall — cron has stopped firing
Highest impact — entire network sync stops
What it is: The WordPress cron scheduler has stopped firing altogether. Queue entries are being created when user events occur, but the processor that empties the queue is not running. The queue depth grows with every user action on the master site while nothing reaches the connected sub-sites.
Common causes: A plugin or code change that inadvertently removed or conflicted with the scheduled cron event. A hosting environment change that altered how WordPress cron is handled. An object caching plugin that cached the cron schedule in a way that prevents updates from being recognized. Very low site traffic causing long gaps between cron triggers.
Data at risk
Every user event from the moment cron stopped until the moment it resumes. New registrations are not synced, password changes do not propagate, profile updates are lost in the queue. The longer the stall, the larger the backlog. Backlog items are recoverable if the queue persists them, but require careful processing to avoid ordering issues.
2
Sub-site API connection timeout or refusal
Affects one sub-site; others continue normally
What it is: The queue processor fires on schedule and picks up pending events, but when it attempts to deliver them to a specific sub-site via REST API, the connection times out or is actively refused. The cron is healthy. The master site is healthy. One sub-site is either down, unreachable, or its REST API endpoint is returning an error.
Common causes: Sub-site hosting outage or maintenance window. A security plugin on the sub-site that has blocked the master site’s IP. A WAF rule that is rejecting the sync API requests. An expired or invalidated API key on the sub-site. An SSL certificate issue on the sub-site causing HTTPS connection failures.
Data at risk
All user events destined for the affected sub-site. If the queue retries failed events automatically, data is preserved as long as the retry window covers the outage duration. If retry limits are exhausted before the sub-site recovers, those events may need to be reprocessed manually or via a Bulk Push.
3
Queue backlog — processing falling behind event creation
Growing lag — degrades into stale data over time
What it is: The queue is processing, but not fast enough. New events are arriving faster than the processor can clear them. The queue depth grows steadily, and the time between a user event occurring and it being delivered to sub-sites increases from minutes to hours. The system is not failing — it is lagging. Without intervention, lag eventually becomes so significant that sub-site data is effectively operating on a different reality from the master.
Common causes: A marketing campaign or viral moment driving a registration spike that exceeds the queue’s normal processing rate. A batch size configured too small for the network’s actual traffic volume. A slow sub-site API that takes too long to respond, reducing throughput per batch cycle. Too many connected sub-sites for the current batch processing settings.
Data at risk
No data is lost, but freshness degrades. A user who registered an hour ago may still not have an account on connected sub-sites. If the backlog contains conflicting events for the same user (multiple profile updates), ordering becomes critical. Backlog situations also increase the stale-data conflict risk described in the conflict resolution context.
4
Silent individual record failures — events that fail without retrying
Hardest to detect — leaves specific users unsynced
What it is: The queue processes normally for the vast majority of records, but specific individual records fail consistently and are marked as permanently failed rather than retried. The overall queue depth looks healthy. The overall sync appears to be working. But a subset of specific users — possibly just one or two — are never synced because their records trigger a consistent failure on processing.
Common causes: A user record containing a character encoding issue that causes the API request payload to fail validation on the sub-site. A user whose email address on the master conflicts with an existing account on a specific sub-site. A custom meta value that exceeds the sub-site’s REST API request size limit. A user record with a corrupted serialized meta value that causes a PHP error during sync.
Data at risk
Specific users are permanently unsynced. Without detailed event logging that records individual failure reasons, these cases are nearly impossible to identify without a complaint. The affected user may never appear in any aggregate health metric because the queue itself is technically processing fine.
5
API authentication failure — connection key invalidated
Affects all events for a specific connection
What it is: The API key used to authenticate sync requests to a sub-site has been invalidated. This can happen when an administrator on the sub-site regenerates the connection keys, when the sub-site is restored from a backup that predates the current key, or when a security plugin invalidates all API keys as part of a security response. All sync requests to that sub-site return 401 or 403 responses, and all queue events destined for it fail.
Common causes: Sub-site restored from a backup that predates the key generation. A security incident response that rotated all API credentials. A WordPress plugin that purges application passwords or API keys during its operation. An administrator regenerating keys without coordinating with the master site configuration.
Data at risk
All events for the affected sub-site from the moment the key was invalidated. Recovery requires re-establishing the connection and running a Bulk Push to resync all user data that accumulated during the outage window. The Bulk Push will catch the current state but will not replay individual change events that occurred during the gap.
6
Database write failure on the destination site
Sync reaches the sub-site but fails to commit
What it is: The sync queue fires correctly, the API request reaches the sub-site and passes authentication, but the write operation fails on the sub-site’s database. The master site receives an error response from the sub-site’s REST endpoint and the queue entry is marked as failed. This is a sub-site-side failure that the master site correctly detects but cannot resolve on its own.
Common causes: Sub-site database running out of storage. A database table lock caused by another concurrent operation (a large import, a plugin update, or heavy traffic). MySQL max_allowed_packet limits being exceeded by a large user meta payload. A corrupted database table on the sub-site that is rejecting write operations.
Data at risk
Events that fail due to transient database conditions (table locks, temporary storage issues) will succeed on retry once the condition clears. Events that fail due to persistent conditions (full disk, corrupted table) require sub-site infrastructure remediation before retry will succeed. The event log records these failures and allows targeted retry once the sub-site is healthy.
7
Event creation failure — events not entering the queue at all
Upstream failure — queue appears healthy but is starved
What it is: User events are occurring on the master site but the sync plugin is not detecting them and therefore not creating queue entries. The queue processor is running and would process entries if they existed, but the event hooks that should be triggering queue creation have been disconnected. This looks like a healthy, empty queue — which is exactly how a healthy queue looks when there is no traffic. The failure is invisible unless you know to check whether events should be accumulating.
Common causes: A plugin conflict that has de-registered the WordPress hooks that the sync plugin relies on to detect user events (user_register, profile_update, password_reset). A plugin update that changed the event hook priority. The sync plugin being deactivated and reactivated during an update in a way that lost its hook registrations.
Data at risk
Every user event from the moment hooks were disconnected. Since no queue entries were created, there is no automatic retry path. Recovery requires identifying the gap window, running a Bulk Push to capture current state, and separately handling any events (like password changes) that cannot be reconstructed from current state alone.
The monitoring signals that detect queue problems before users do
Every failure mode described above produces detectable signals before it produces customer complaints — if you know what to look for and how often to look. The following monitoring framework gives you visibility into queue health at the level that catches problems in their early stage rather than their customer-impact stage.
Signal 1: Queue depth trend over time
What to watch: The number of pending queue entries. A healthy queue should have a depth that stays low — ideally under a few dozen entries at any given time outside of traffic spikes. What triggers concern: A depth that grows consistently over hours without declining indicates a processing problem. A depth that spikes sharply and then declines is normal during a registration event; one that spikes and stays elevated is not. Check depth at regular intervals and compare current to the average for that time of day and day of week.
Signal 2: Age of the oldest pending entry
What to watch: The timestamp of the oldest queue entry that has not yet been processed. Under normal conditions, no entry should remain pending for more than a few minutes. What triggers concern: An entry that has been pending for more than 15 minutes on a normally-trafficked site indicates a processing problem. An entry that has been pending for hours is a confirmed stall. This signal catches cron failures and sub-site outages much faster than queue depth alone, because a single old unprocessed entry is immediately visible even if the overall queue depth looks low.
Signal 3: Failed event count and rate
What to watch: The count of events marked as “failed” in the event log, and the rate at which new failures are occurring. A small number of historical failures is normal — occasional network blips produce isolated failures that retry successfully. What triggers concern: A sudden increase in the failure rate for a specific sub-site (indicating Failure Modes 2, 5, or 6), or persistent failures for specific user IDs that keep reappearing in the log (indicating Failure Mode 4). Failed events should be reviewed within 24 hours of occurrence.
Signal 4: Connection heartbeat status per sub-site
What to watch: The last successful communication timestamp for each connected sub-site. A sync plugin with proper connection monitoring should record when it last successfully reached each sub-site, separate from queue processing. What triggers concern: A sub-site that has not had a successful connection in more than 30 minutes. This is the earliest possible indicator of Failure Mode 2 (sub-site down) or Failure Mode 5 (API key invalidated), caught before any actual sync data is put at risk.
Signal 5: Last successful processing timestamp
What to watch: When the queue processor last ran and successfully completed a processing cycle. This is the direct indicator of cron health. What triggers concern: A gap of more than 10 to 15 minutes since the last processing cycle on a site with normal traffic is a cron health warning. A gap of an hour or more is a confirmed cron failure (Failure Mode 1). This timestamp should be checked every time you open the queue panel, and should be part of any automated monitoring setup.
Recovery procedures: how to handle each failure type cleanly
Detection without a clear recovery path is only half the problem solved. Each failure mode has a specific recovery sequence. Using the wrong sequence — for example, running a Bulk Push when you should be clearing a backlog — can cause additional problems. Here is the correct recovery approach for each failure type.
Failure mode
Correct recovery sequence
Cron stall (Mode 1)
Verify cron is not firing using a cron monitoring tool or the WP Crontrol plugin. Identify and resolve the cause. Manually trigger the queue processor once cron is restored. Let the existing backlog process in order — do not run a Bulk Push over it, as the queued events contain incremental changes that a bulk push would not capture.
Sub-site timeout (Mode 2)
Identify why the sub-site is unreachable (hosting, security plugin, WAF). Resolve the connectivity issue. The queue will automatically retry failed events for that sub-site once connectivity is restored. Check the failed event count after recovery and manually retry any events that exceeded the automatic retry limit.
Backlog buildup (Mode 3)
Do not purge the backlog — it contains real events. Increase the queue batch size setting to process more events per cron cycle. If the sub-site causing slow responses is identified, investigate and address its performance. Monitor queue depth hourly until it returns to baseline. After clearing, review batch size settings against your typical traffic volume.
Individual record failures (Mode 4)
Use the event log to identify the specific user IDs and the failure reasons recorded for each. Investigate the user record on the master site for data issues. Fix the root cause (encoding, conflicting email, meta corruption), then manually retry the failed events for those specific users. Do not run a full Bulk Push just to address a handful of records.
Auth key invalidated (Mode 5)
Re-establish the connection by generating new keys on the sub-site and updating the master site’s connection configuration. Once connectivity is restored, run a targeted Bulk Push to that specific sub-site to resync all current user state. This will not recover incremental changes made during the outage window, but will ensure the sub-site reflects the current master state.
DB write failure (Mode 6)
Resolve the sub-site database issue (storage, table repair, packet size). After infrastructure is healthy, retry failed events — the queue system should retry them automatically once successful connections resume. Verify the retry succeeded for each previously failed event via the log.
Event hook disconnect (Mode 7)
Identify which plugin update or change caused the hook disconnect. Restore hook registration (often done by deactivating and reactivating the sync plugin cleanly). Run a Bulk Push to capture all current user state — this is the only recovery path since the missing events were never queued. For password changes during the gap, those hashes cannot be reconstructed from a bulk push; users may need to reset passwords on sub-sites if SSO is not active.
Building your monitoring routine: a practical checklist
Monitoring does not need to be complex to be effective. The following checklist gives you a structured routine that will catch every meaningful failure mode described in this guide before it produces customer impact. The frequency recommendations are based on the time-to-impact of each failure type.
Daily checks (2 minutes)
Every morning
Open the Queue tab. Confirm queue depth is at baseline and declining or zero. Check the “last processed” timestamp — confirm it is within the last 10 minutes. Open the Dashboard and verify all connected sub-sites show a green connection status. If anything is amber or red, investigate before the day’s user traffic builds.
Weekly checks (10 minutes)
Every Monday
Open the Logs tab. Filter for “failed” status events from the past seven days. Review each failure: identify the affected user, the failure reason, and whether it was retried successfully. Any failure without a successful retry in the log needs investigation. Also check whether queue depth was elevated at any point during the past week using log entry timestamps as a proxy. If you see clustering of failures around a specific time, correlate with any deployments, plugin updates, or traffic events that occurred then.
Monthly checks (20 minutes)
First of each month
Review the total event volume against network growth. If your user base grew by 20% but your event volume grew by 60%, your queue batch size may need adjustment before a traffic spike causes a backlog. Verify that connection keys for all sub-sites are still valid by checking the Connections tab. Review your retry configuration — ensure the retry window is still appropriate for your longest expected sub-site maintenance window. Spot-check five random user records across master and sub-sites to verify metadata is actually in sync as expected.
Event-triggered immediate checks
Run an immediate queue health check whenever any of the following occur: any plugin is updated on the master site or any sub-site, a sub-site migrates hosting or changes servers, a sub-site is restored from backup, a security plugin is installed or its settings are changed on any site, or a traffic event (sale, campaign launch) drives a registration spike. These are the events most correlated with queue failures and the earliest possible check prevents compounding problems.
A sync queue that you monitor actively is an asset. A sync queue that you set up and forget is a liability waiting to surface at the worst possible moment. The failure modes described in this guide are not hypothetical — they occur on real networks, at real costs, with real customer impact. The monitoring routine above costs less than 30 minutes per week and catches every one of them in time to respond before users are affected.
Nexu User Sync’s queue monitoring and failure recovery tools for WordPress multi-site networks give you the queue depth visibility, connection heartbeat status, per-event failure logging, and Bulk Push recovery capability that this monitoring framework requires. The signals are there. The recovery paths are documented. What remains is the habit of checking them consistently — because the queue that fails quietly is always the one nobody was watching.
Queue Depth Monitoring · Connection Heartbeat · Per-Event Failure Log · Bulk Push Recovery
Know when your sync queue has a problem. Before your customers do.
Nexu User Sync provides the queue visibility, connection health monitoring, detailed failure logging, and recovery tools that professional multi-site WordPress network administration requires.
Nexu User Sync by NEXU WP
WordPress plugin · Queue Monitoring · Failure Detection · Auto-Retry · Bulk Push Recovery
Get Nexu User Sync





Just snagged this guide after a coworker in dev ops wouldn't stop raving about it. That section on how everything appears fine while the queue just quietly dies? Yeah, that's the exact disaster we hit last quarter lost two full days of user updates before the support tickets even started coming in
My only issue is that by the time you catch the problem through support tickets, the damage is already done. would be nice to have some kind of early warning system in place
Hey everyone! Just finished reading this sync queue guide and wow it actually explains why these failures happen in plain English. No vague tech jargon, just clear breakdowns of each failure mode and what it means for your site